I‘m back again with a big update to the Head-to-Head Player Comparison Tool at fantasyondraft.com. The Head-to-Head Player Comparison Tool consolidates meaningful data to assist in making sit-or-start decisions.
#New updates for this week:
- Floor and Ceiling Projections, based on weekly projections, average performance deviations.
- Points Breakdown Section, with a graphical depiction of how players earn fantasy points each week.
- Expanded Performance Trends, which now include a “Group Best” performance, outlining how a player’s performance compares to the best of the comparison group.
- Expanded Snap Trends, which now include utilization percentages.
- Comparison Labels, for easy, at-a-glance decisions. Includes Most Consistent, Best on Average, Safest Play, Most Risk, and Highest Upside.
- Various performance improvements and bug fixes.
#Background For years, I’ve searched for a tool with the combination of data I wanted to help me make tough sit-or-start decisions. Most sit-or-start tools rely solely on comparing players in a vacuum by projections or rankings, with some of the better tools utilizing consolidated rankings. While these tools are fun to play around with, I find that they don’t (and can’t) take into consideration all the variables associated with a sit-or-start decision. For instance:
- Do I need a safe, floor play or a risky, high-upside play?
- How consistently has this player performed in the last few weeks?
- How involved is this player on a play-by-play basis?
- How have similar players performed against this opponent?
- How is this player’s team expected to perform?
When knowing all of these variables, I find that my confidence in making a decision is significantly higher than blindly relying on site projections or a boilerplate sit-or-start tool. Furthermore, when decisions don’t pan out, an understanding of these other variables can highlight how out-of-the-norm a bad performance may be and help you avoid unnecessarily blacklisting a player. It also alleviates some of the pain in making the “wrong” choice. Doing this research manually for every sit-or-start decision, however, is quite fatiguing. That’s where this tool comes into play.
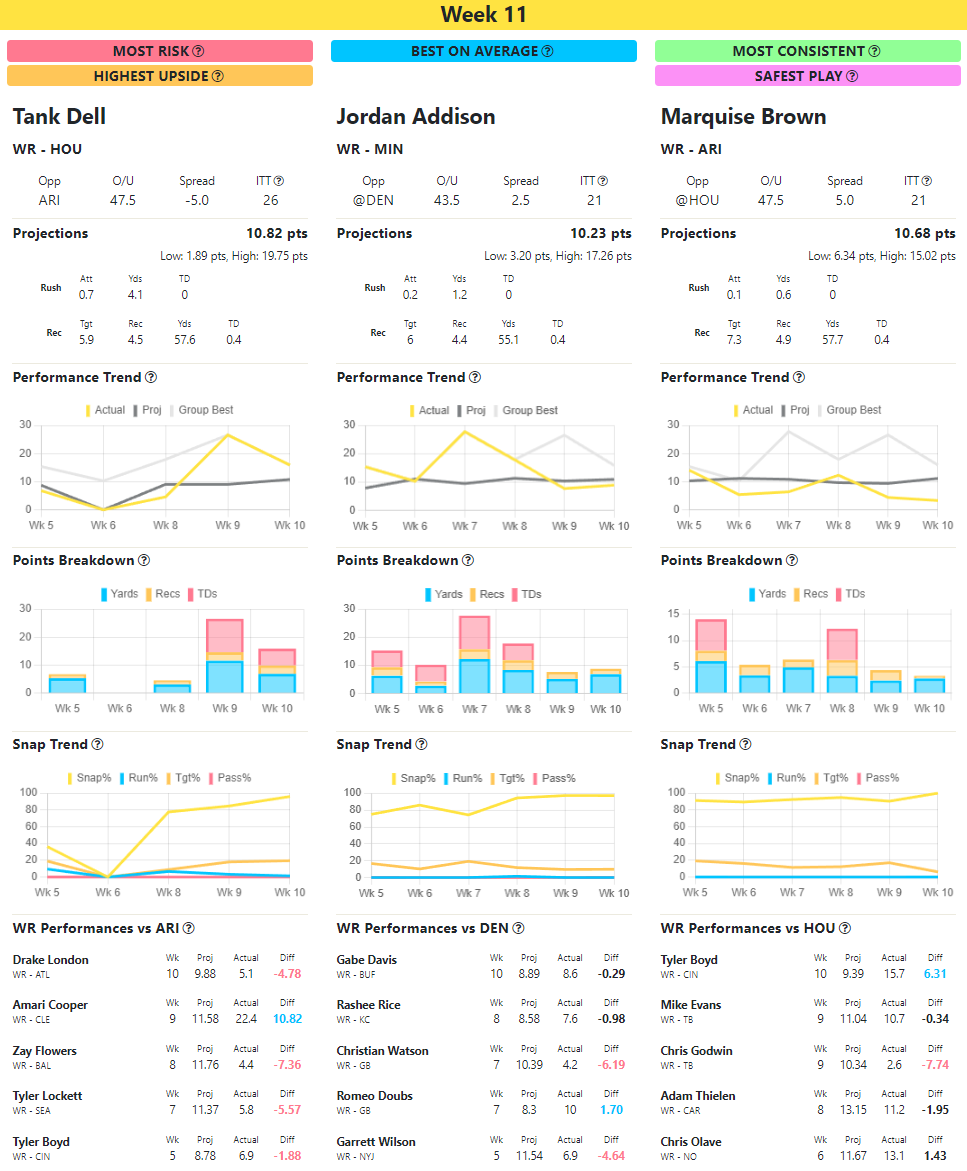
#Tool Overview When comparing players with the Head-to-Head Player Comparison Tool, 6 key sections are available to explore:
- Matchup Details - displays player, team, position, injury status, opponent, over/under, spread, implied team totals, and high-level comparison labels.
- Projections - displays projected game stats, projected fantasy points, projected floors, and projected ceilings.
- Performance Trends - a graphical view of the weekly projections and actual performances of the player. This is a great way to understand the consistency of the player, whether they are a floor play or an upside play, and if they have been over performing or in a slump. A “group best” performance is also shown, which is the best performance of the week within the group of compared players.
- Points Breakdown - a graphical view of how the players earn their fantasy points each week. For offensive players, this focuses on yards, touchdowns, and receptions. For defensive players, this focuses on tackles, turnovers, and passes defended.
- Snap Trends - a graphical view of weekly snap percentages and how the player is utilized. For offensive players, this focuses on how often the player runs, is targeted, or passes. For defensive players, this focuses on how often a player is involved with a tackle or a defended pass. This view should highlight any participation trends that are worth noting.
- Past Performances vs Opponent - a breakdown of all “similar” players who have performances against the opponent of the player you are comparing. Each past performance displays projected fantasy points against actual fantasy points, with a difference that is highlighted to easily show underperformances and overperformances.
The combination of these sections should help you outline and weigh the risks associated with each player you are comparing. Ideally, one player will stand out as the “best” choice, but sometimes, it really can come down to a coin flip. In these cases, at least you have some data to back up the decision to flip a coin.
Additionally, there are options to swap scoring settings, set the data range, change the definition of a similar player, adjust the performance highlight threshold, and display expanded stats for each past performance.
#What this tool is not: This tool is not going to magically make decisions for you, and I’m hesitant of any tool that says it truly can (consistently and accurately, anyways).
#What this tool is: This tool will give you the data you need to form your own decision, making you a better fantasy manager in the process.
#This tool is FREE to use when comparing two offensive players in standard, ppr, or half-ppr scoring.
For those looking to compare individual defensive players (IDP), use custom scoring settings, or compare 3-4 players simultaneously, I have a premium membership that includes all of these features.
#Data Sources
- Projections and historical stats are from SportsData.io.
- Over/Unders and Spreads are from DraftKings via The Odds API.
The tool updates for the upcoming week each Tuesday night/Wednesday morning. Odds are updated twice daily. Projections are updated daily.
Finally, I’m always looking for feedback to improve my tools. If you have an idea for a feature or tool, let me know!
I just did a comparison where Best on Average and Most Consistent were different people. How is the best on average different than most consistent?