
lunduke is possibly the biggest asshole in the Linux space. do not share his garbage “journalism”.
deleted by creator
oh Bryan Lunduke? can someone spare me a grain of salt before I click the link? appreciaet it.
-
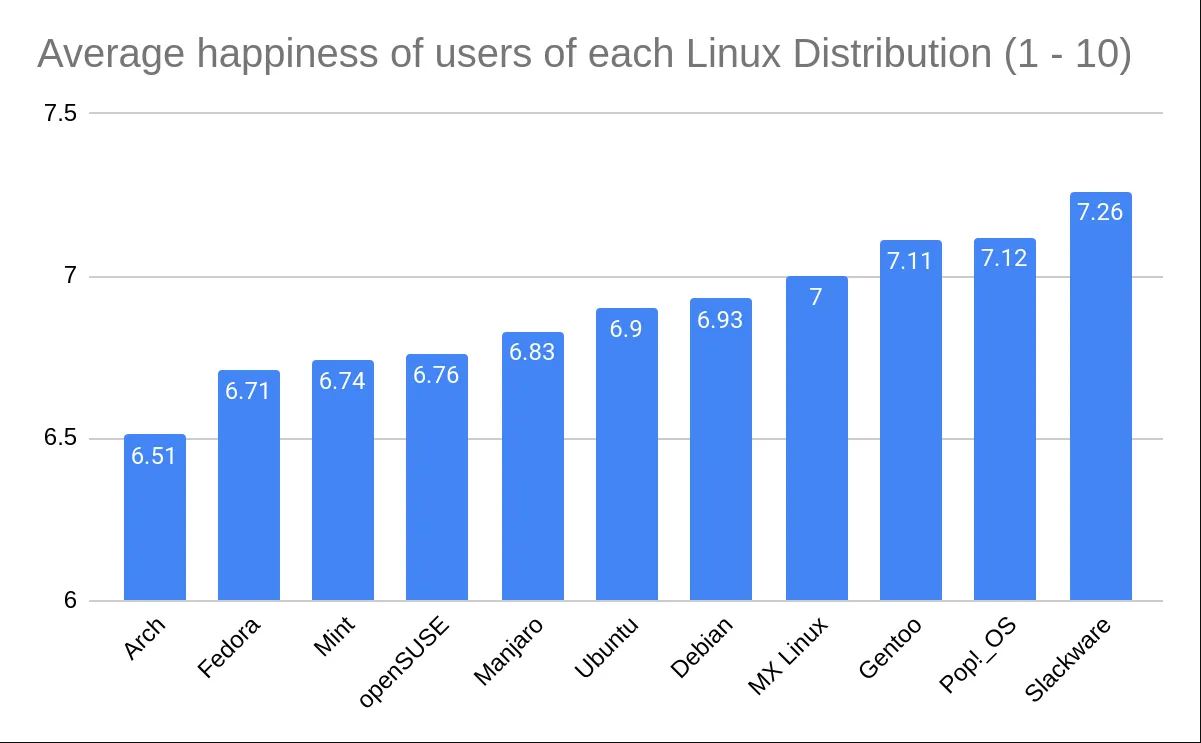
That’s a misleading Y-axis. The difference (in self-reported subjective happiness rating 1–10 too) is not as significant as the graphic implies visually.
-
Phew, I use Librewolf on Artix Linux. I’m safe 👍
The difference (in self-reported subjective happiness rating 1–10 too) is not as significant as the graphic implies visually
Ah here is another one. So what? It makes the difference more distinguishable, which also the graph denotes numerically. Otherwise all Linux distros users would appear too flat to make any difference interpretable.
The fact that there are at least two such comments around here shows why teaching anything in schools is doomed to fail.
Even critical thinking skills are applied in a canned, thought-terminating fashion, similar to how XX/XY chromosomes are considered the only reality, in overconfident falsehood.
What a bizarre reply. It implies that the difference is statistically significant when it’s in fact much less so.
Otherwise all Linux distros users would appear too flat to make any difference interpretable.
That is the point. The graph obscures this.
Ah the statistical significance, which as everybody knows is assessed …visually? Mic drop
BTW I have another comment here, totally irrelevant to this discussion, that I bring up statistical siGnifiCAnsE as an example of confident falsehood. Thanks for proving me right lol
Edit: here it is for context ( from https://lemmy.ml/post/17638298/12096466 )
Layman statistics is not the hill I would die on. Otherwise (being guilty of the fallacy myself) I now think that making a subject mandatory school lesson will only make people more confidently incorrect about it, so this is another hill I won’t die on for probability and statistics. See for instance the widespread erroneous layman use of “statistical significance” (like “your sample of partners is not statistical significant”) you see it is a lost cause. They misinterpret it because they were taught it. Also professionals have been taught it and mess it up more than regularly to the point we can’t trust studies or sth any more. So the solution you suggest is teach more of it? Sounds a bit like the war on drugs.
I’m not trying to do layman statistics. I’m stating that the graph obscures the magnitude of the difference between people’s ratings. You seem to be suggesting that I’m trying to do some kind of formal or specialist critique of the graph. I’m not. I didn’t go to school or anything and I am simply making a lay observation. If you disagree with it you can say without being so obfuscating yourself.
Although there is a common tip in critical thinking classes that manipulating the Y-axis range can lead to misleading presentation of a difference, I believe in this particular graph, which clearly provides numbers to compare, you can’t say it is misleading.
People can read and compare the values and draw their own conclusions. And I am saying that without any consideration of the distros discussed, since I am impartial to distros, I like all distros I have tried.
This “study” almost certainly must have way deeper assumptions- and metrics- related problems to start with, so even finding myself having this argument is preposterous. But I am just pointing out the misapplication of critical thinking guideline, and this is a valid point which I insist everyone who relies on to consider, if you care about critical thinking at all.
No one said you are doing layman statistics, the pasted comment is from another discussion, provided here for context, and for very good reasons. It aligns with obvious misconceptions about statistics that should be pointed out. Probability and statistics are thorny subjects that nonetheless are inevitable in order to understand the world surrounding us, material, social, and economic, so yes I will nitpick here and call out the misapplication of canned critical thinking thought-terminating cliches.
I am not trying to apply a “critical thinking guideline” I saw elsewhere. I’ve not taken any “critical thinking classes”. I’m more insulted that you think I couldn’t have possibly just thought of that comment myself. It’s not a particularly crazy comment to make, and I don’t see why any individual who knows how to read graphs couldn’t just happen to make that comment.
Anyway—sure, I never said the graph lied. Perhaps a better wording would be that, regardless of how the information is presented, I don’t think the difference in magnitude between people’s happiness ratings (ignoring the issues with how those ratings were collected and ascertained in the first place) is significant or particularly of note. The Y-axis is chosen so as to visually amplify this difference. I didn’t claim the data presented by the graph was untrue or that reading the graph correctly was too difficult if one wanted to read it properly.
I really did not mean to be insulting. I am just saying chart makers can choose to make a zoom in, and it is not automatically propaganda or something. All this has led people astray of the real issues, like WTF is measuring ‘happiness’ on a 1-10 scale, and what are the metric properties of this 1-10 scale. Then there are all the sampling issues and what have you. I just expected more people discussing this stuff rather than the Y-axis.
-
These results seem freaking bizarre and I’m highly skeptical. You’re telling me that Slackware users, freaking SLACKWARE, are the happiest? And Firefox is the least happy? I am so much happier using Firefox than have been with Chrome for at least a decade.
The question wasn’t how happy users are with their distro, but in general. My theory is, people who have a lot of great things going on in their life (wife, kids, social life) don’t bother installing Arch.
I wonder if people using steam decks know they are running Arch.
Wow, no need to make this personal. /s
The score seems very similar to that of the US average life satisfaction score of 6.72. I assume the survey was done in the US.
This seems like a classic case of Confounding . The happier scores seem to be from people that have more money (ios, macos ,pop os) , and people that have technical skills (slackware, gentoo , mobile linux) which are probably more educated and earn more money which iirc according to research correlates with being more happy. Arch users might have higher screen time which might cause lower levels of happiness. slackware might have older users which iirc according to research are happier.
Of course this is not a scientific study , it hasn’t been peer reviewed and this could all be statistical noise.
I think the best way to make linux users happier is have by default in the distro a course on being happier, i can’t find the link but iirc the course on coursera increased the score by 1 point (so probably somewhere around from 6.7/10 to 7.7/10), I spent a while learning about this stuff and experienced a similar jump (Although i don’t know if i will keep it if there will be some strong negative event).
The polling period was also short, and for many might be during winter months where happiness reporting could be less
I use Arch! How dare you say that I am unhappy? I am frothing at my mouth! I am totally happy, can’t you see that? CAN’T YOU SEE THAT???
Happily using Pop! OS, cheers!!
@superkret But where is nixos?
It looks like it’s about doing real work instead of tweaking your distro 🫠
I feel like this post would have been downvoted a lot less if I had altered the title to “Slackware users are the happiest!😊”


